Premier Analysis: Hospital-Led ACOs Perform as Well as Physician-Led Models

Key takeaways:
- CMS policy forces ACOs that include hospitals as formal network members, known as high-revenue, to assume greater levels of performance-based risk in the MSSP because they assume that low-revenue, physician-only ACOs are better able to achieve savings targets.
- Premier analysis shows the differences between high-revenue and low-revenue ACOs have more to do with cherry picking locations and attribution methodology than with real performance.
- Continuing to distinguish ACO participants as high- versus low-revenue creates an unlevel playing field that disadvantages ACOs that include hospitals relative to their physician-led counterparts.
The Medicare Shared Savings Program (MSSP) was established under the 2010 Affordable Care Act as a means of making care more efficient and controlling costs within a traditional fee-for-service payment system. Accountable care organizations (ACOs) are designed to reward providers for furnishing high-value care through various incentives, including shared savings.
Over time, the program has evolved to align with the Centers for Medicare and Medicaid Services’ (CMS’) priorities. In 2018, CMS finalized a program overhaul of the MSSP under its Pathways to Success reforms. A primary intent of Pathways was to adjust incentives to ensure that lower-performing ACOs would move into risk-bearing tracks and avoid “parking” in an upside only track indefinitely.
One of the notable policies that CMS adopted within Pathways is a distinction between low-revenue and high-revenue ACOs. The distinction is determined based on the amount of fee-for-service (FFS) revenue paid to ACO participants as a percent of total FFS expenditures for attributed beneficiaries, regardless of site of care. Most ACOs that include a hospital as a formal network meeting via listing on their participation list are classified as high revenue, while ACOs that only include physicians - especially those that only include primary care physicians - are often generally classified as low revenue.
This policy is built on the dual-premise that: 1) physician-comprised ACOs (low revenue) perform better in reducing expenditures than ACOs who include a hospital-(high revenue) and 2) that that low-revenue ACOs lack the resources and capital to take on risk more quickly.1
Under Pathways, CMS requires high-revenue ACOs to progress to risk at a much faster clip than low-revenue counterparts. High-revenue ACOs determined to be inexperienced with performance-based Medicare ACO initiatives may participate in the BASIC (upside-only, shared savings) track for a single agreement period. Those determined to be experienced with such initiatives are restricted to participating in the ENHANCED (greatest risk-sharing) track, with a limited one-time exception for BASIC track participants.
Premier consultants have more than 12 years’ practical experience helping create successful operating models for ACOs across the revenue spectrum. Based on their on-the-ground experiences, neither of CMS’ assumptions about high- versus low-revenue ACO performance hold true. To test that belief, Premier conducted data-driven research to test the dual-premises – around revenue and physician versus hospital leadership – on which the high-low revenue distinction is based.
Finding #1: Low-revenue ACOs are better able to cherry pick locations to ensure they reduce spending and achieve savings targets.
The analysis found that high- and low-revenue ACOs operate in distinctly different geographies. An assessment of the 2020 program showed 26 percent of physician-led ACOs operate in just two states, Florida and Texas.
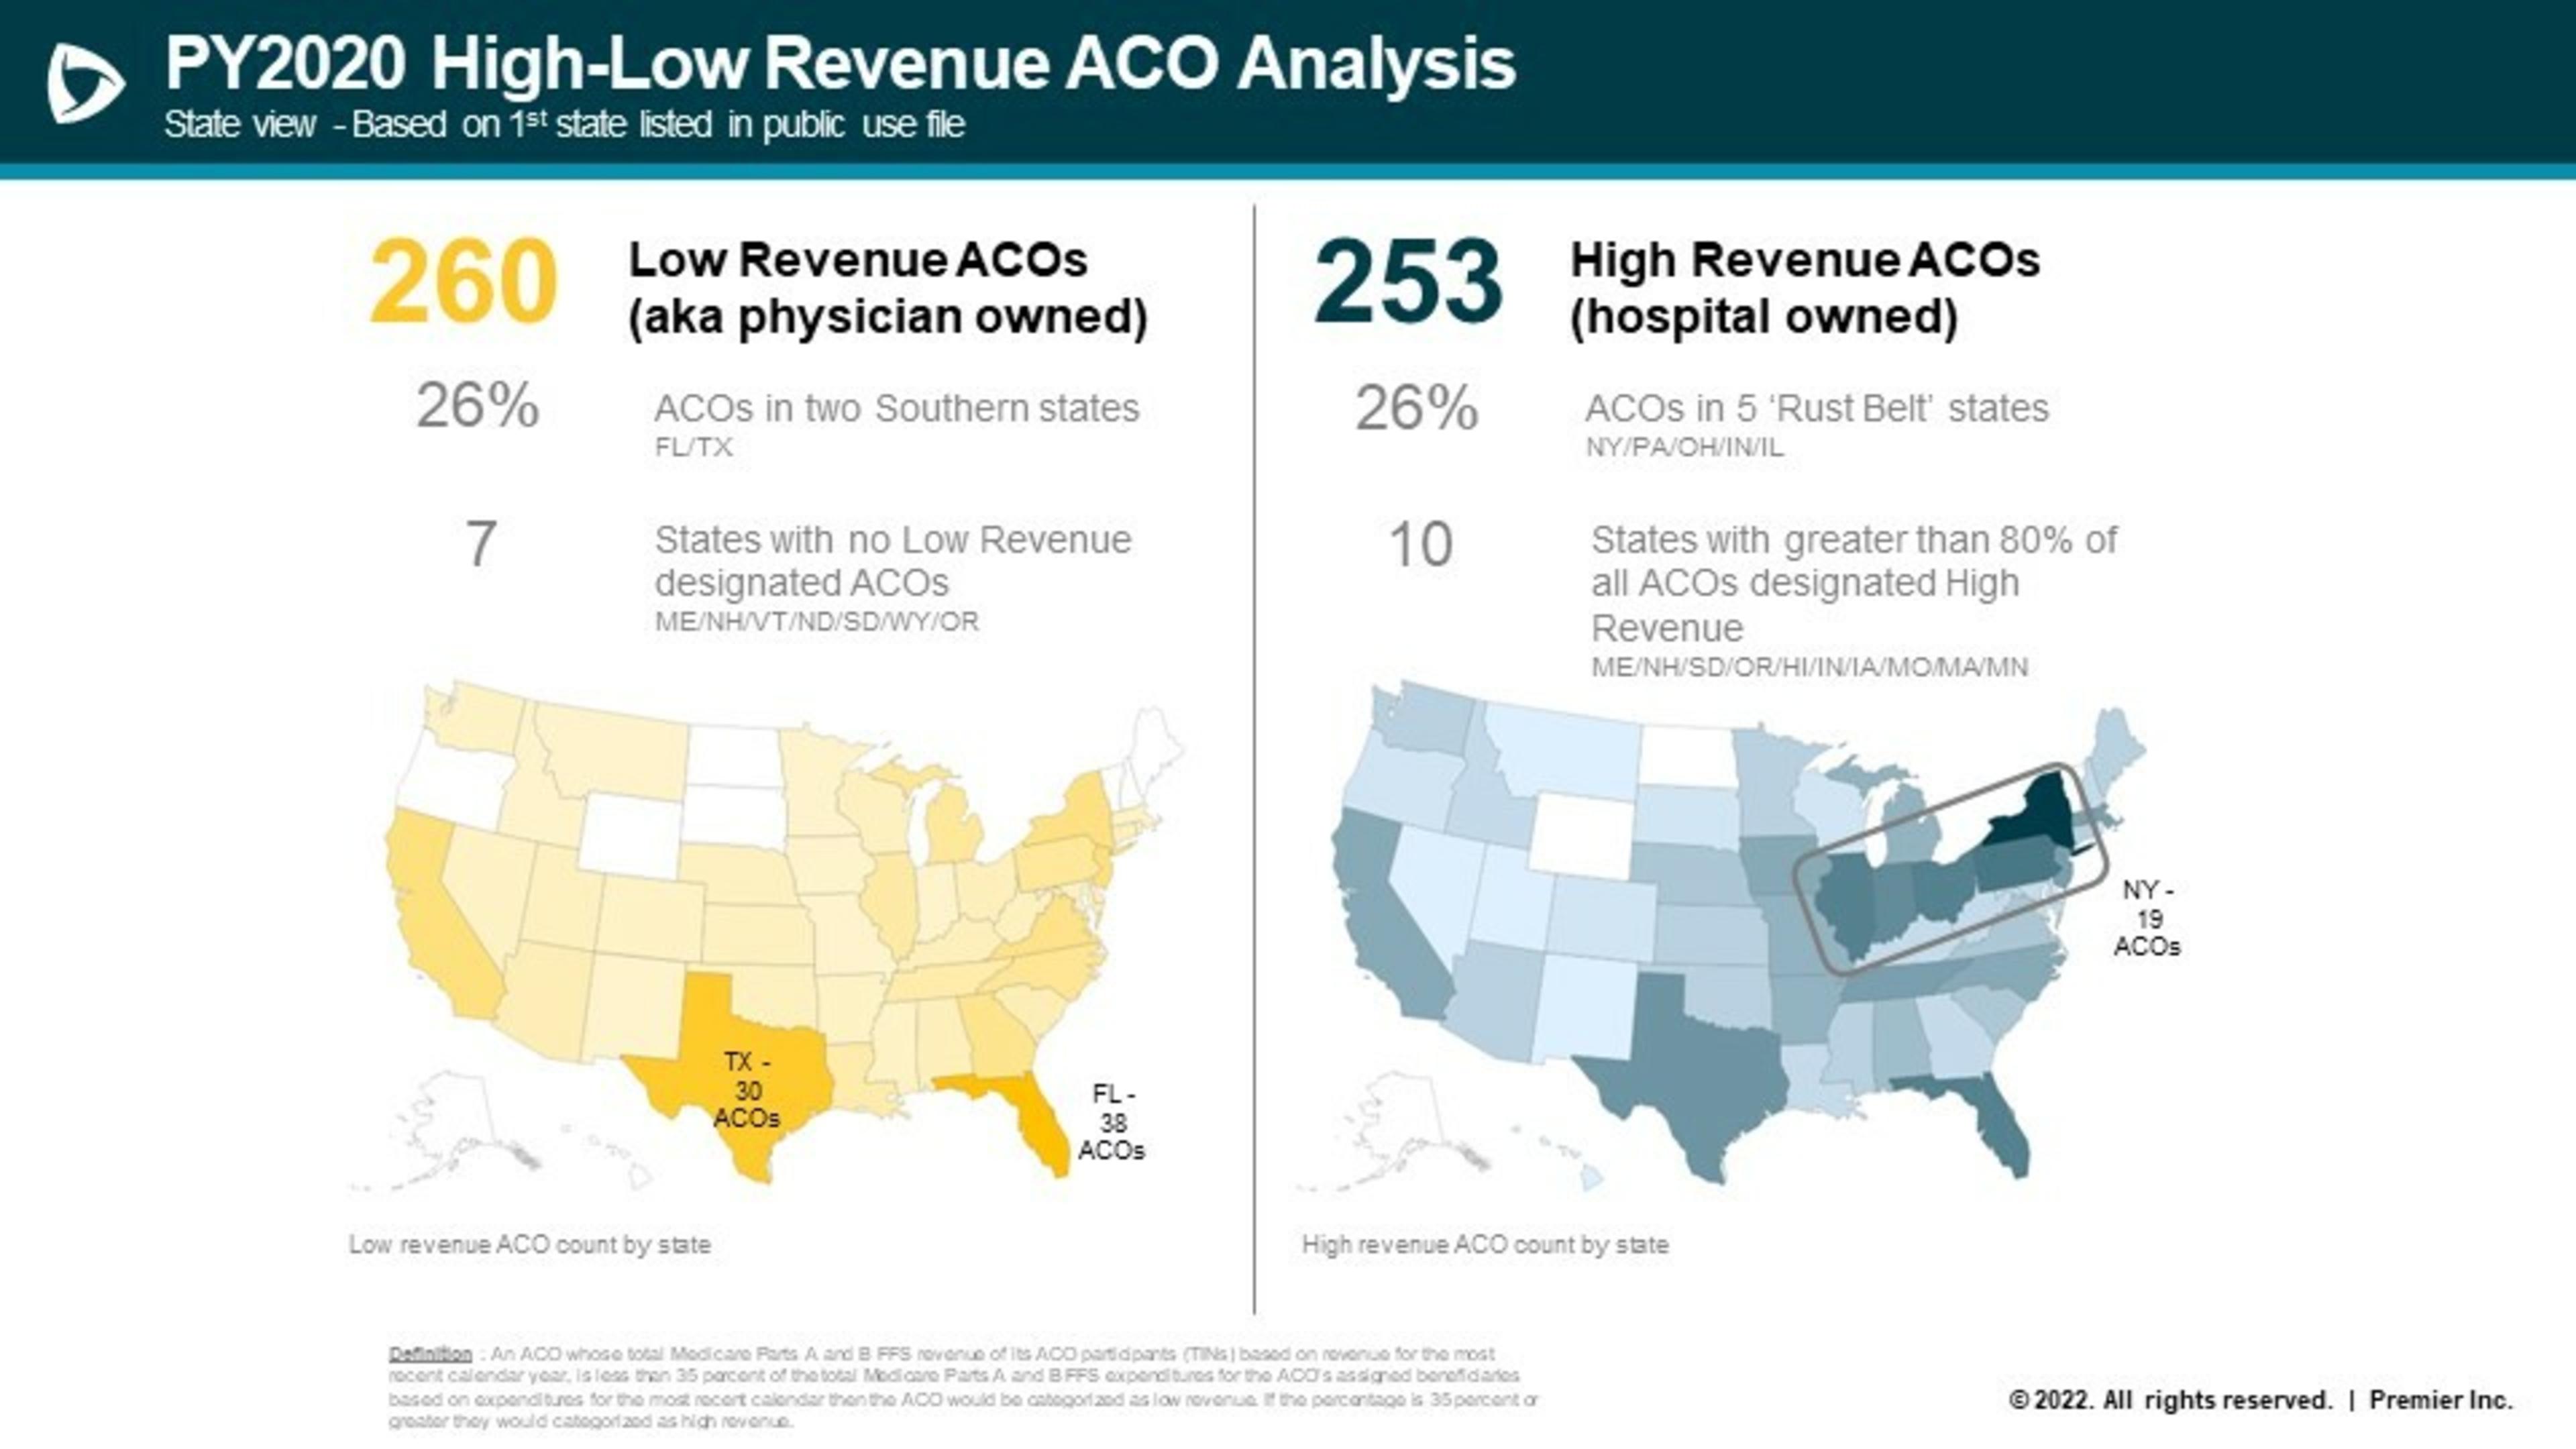
These states have dramatically higher benchmarks than ACOs in other regions (see table below). This is important because higher benchmarks mean there is much more opportunity to achieve savings through better coordinated care.
Similarly, there are no low-revenue ACOs in seven states (Maine, New Hampshire, Vermont, North Dakota, South Dakota, Oregon). These states tend to have some of the lowest Medicare spending in the nation, which in turn drives down the CMS benchmarks and the room for improvement to demonstrate strong savings.
In contrast, high-revenue ACOs provide care to more beneficiaries and operate in more diverse areas. The analysis found that high-revenue ACOs operate in 2,337 counties, versus 1,546 counties for their low-revenue counterparts. As opposed to concentrating in high-cost states, high-revenue ACOs tended to cluster in five Rust Belt states (New Jersey, Pennsylvania, Ohio, Indiana, Illinois) with more moderate benchmarks.
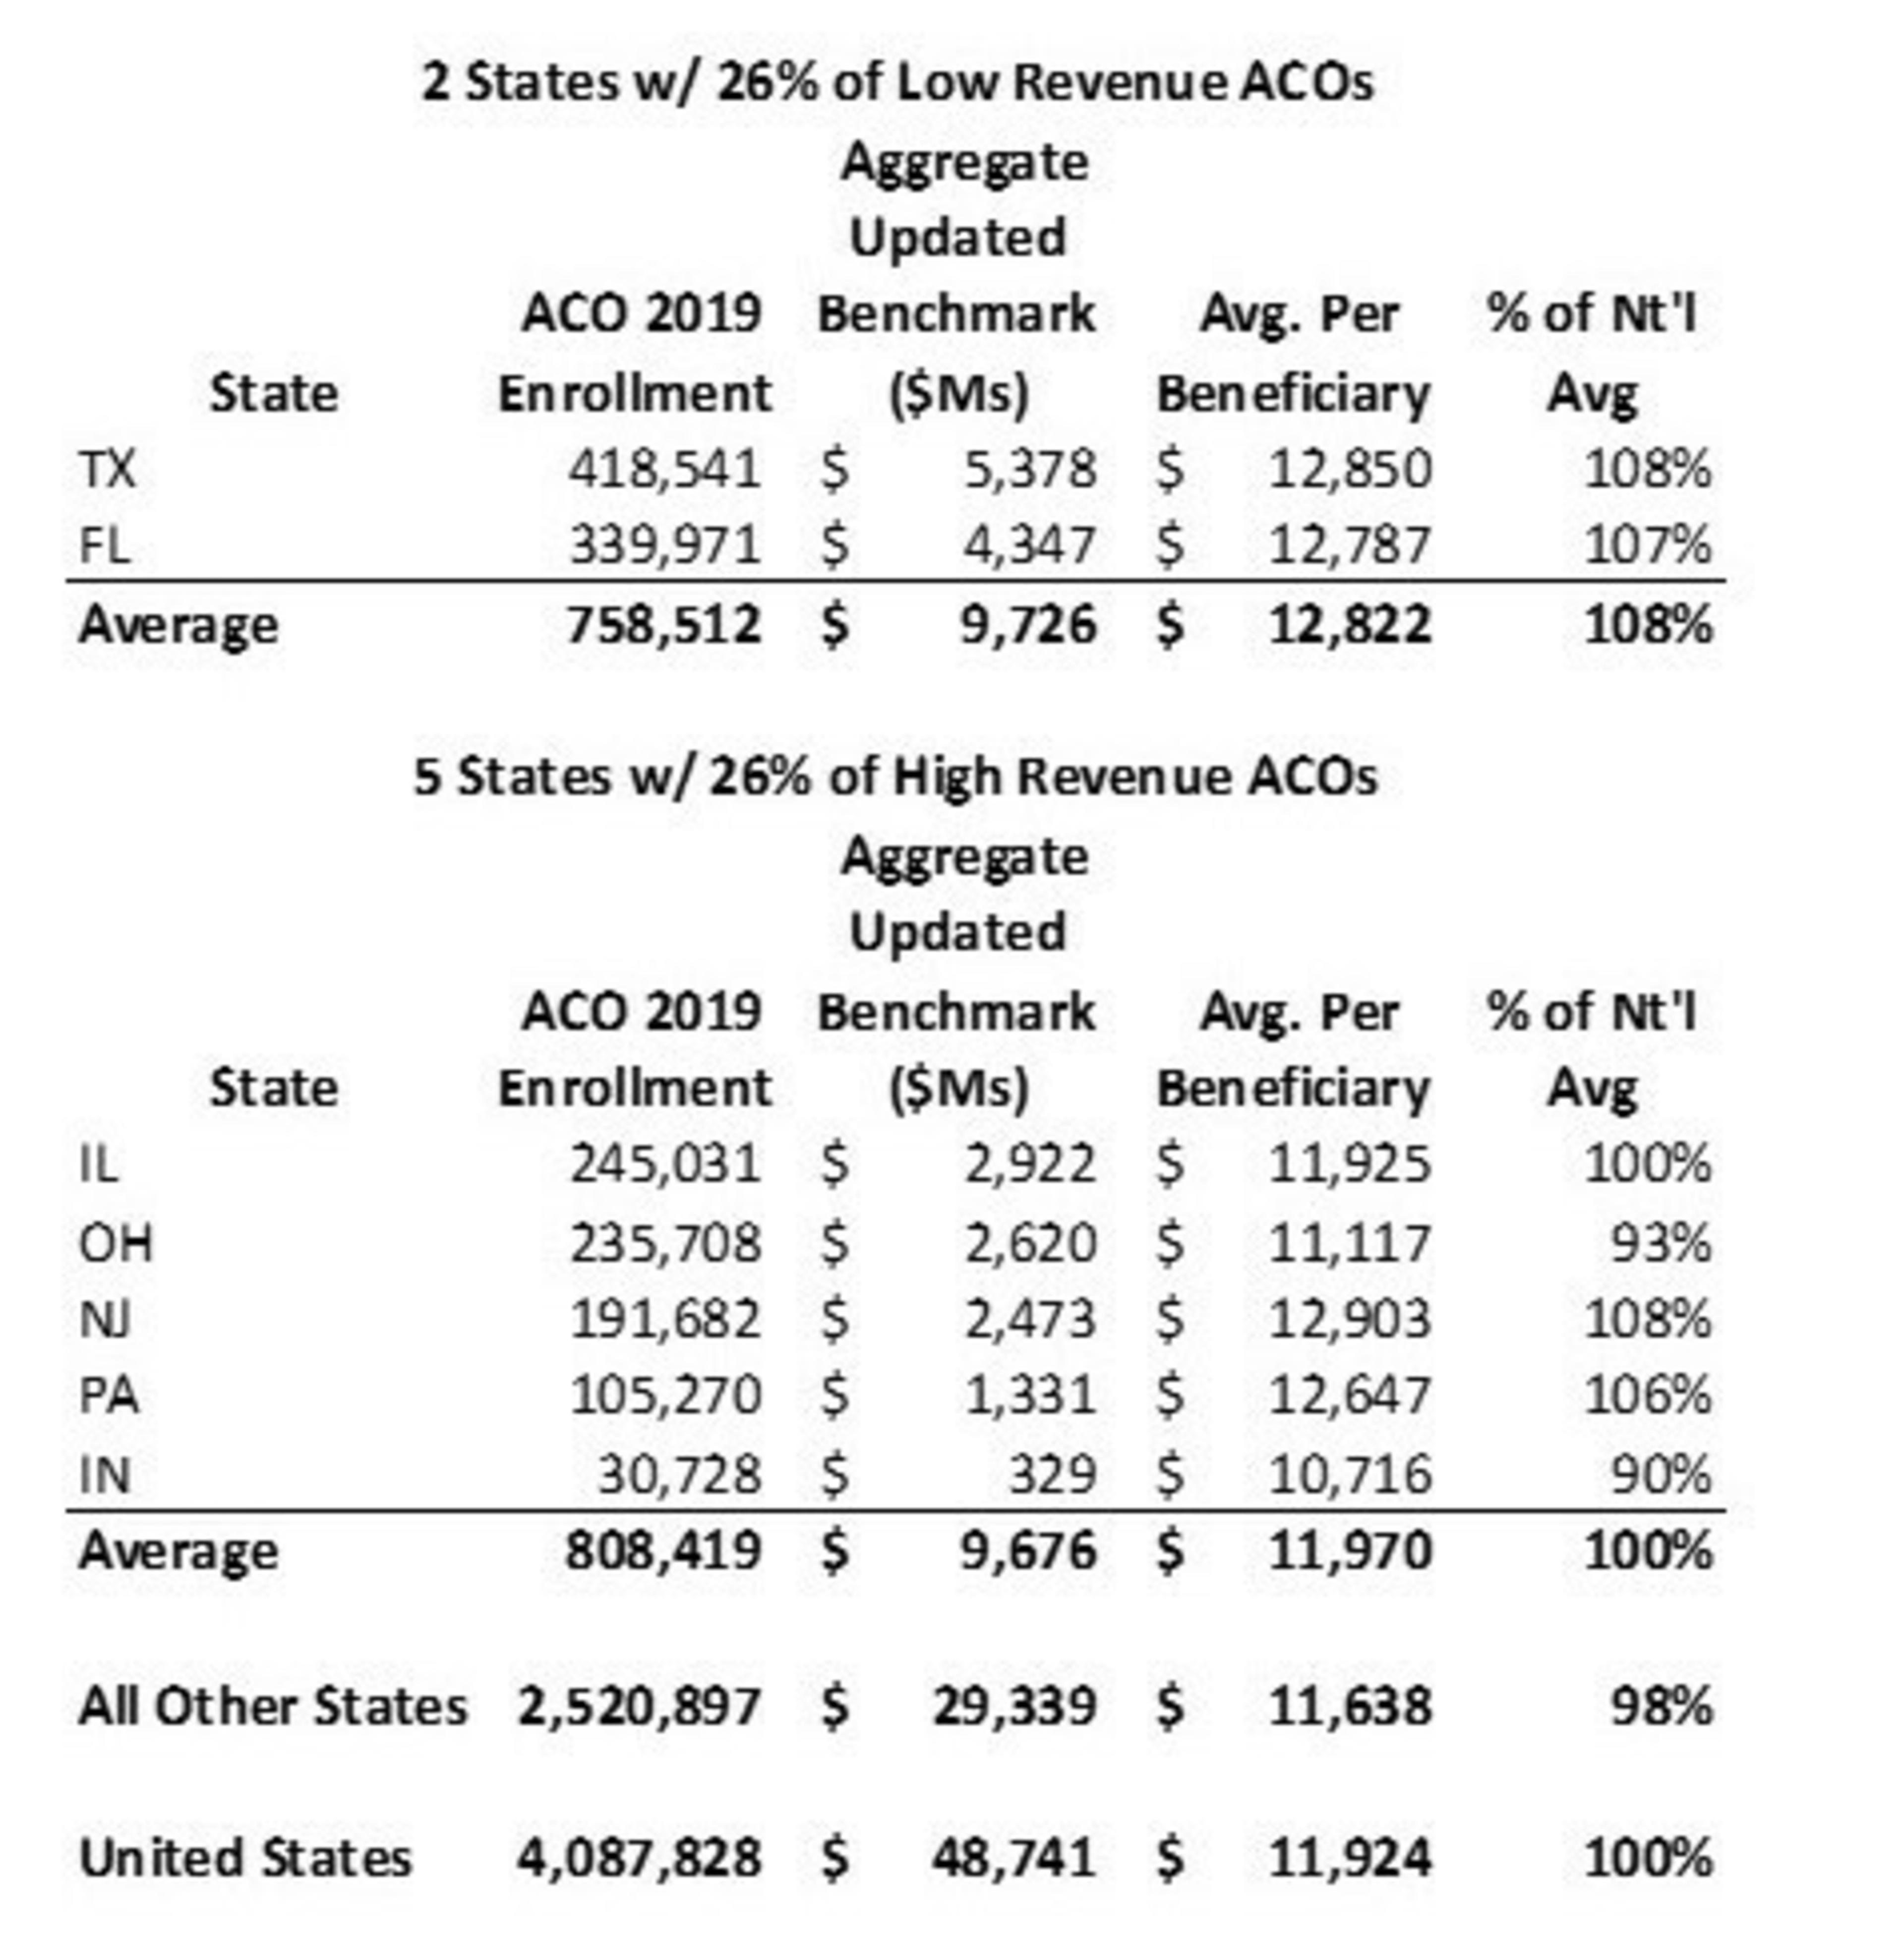
Source: CMS Performance Year Financial and Quality Results for 20192
Overall, the analysis strongly suggests that observed differences in cost efficiency in aggregate between high- and low-revenue ACOs may be due (in whole or in part) to selection bias.
Low-revenue ACOs should not get credit for better performance and distinct advantages over others if differences in savings are due to little more than location choice. In fact, this creates a perverse incentive that could have the unintended consequence of leaving low-spending states out of the movement to value-based care.
Finding #2: High-revenue ACOs have higher cost beneficiaries attributed through specialists.
In the MSSP, CMS uses a two-step methodology for assigning beneficiaries to ACOs. Under Step 1, beneficiaries are attributed to the caregiver providing the most primary care services, inclusive of primary care physicians or non-physician practitioners (NPP), such as a nurse practitioner, physician assistant or clinical nurse specialist. If a beneficiary is not assigned through Step 1, they are assigned based on the specialist physician providing the bulk of medical services (known as Step 2 assignment).
In the MSSP, medical oncology, neurology and cardiology are among the specialties eligible for Step 2 assignment. However, some specialty NPPs are eligible for attribution in Step 1, regardless of the practice type.3 As a result, it is possible for even non-attribution-eligible specialties to drive attribution to an ACO through NPPs.
Specialty physicians typically provide care for higher cost and sicker patents than primary care physicians. Because risk adjustment models underpredict the costs for higher acuity patients,4 ACOs that receive a higher proportion of beneficiaries attributed through specialists are at a distinct disadvantage – they must provide more and more intense services to these beneficiaries, which drives up total costs and limits the ACOs’ abilities to achieve the savings that the MSSP rewards. This creates a disincentive for ACOs that have large number of specialists and for specialist participation in general.
To give a specific example, consider a recently diagnosed cancer patient. The beneficiary will be attributed to an ACO through the patient’s oncology specialist while the patient is undergoing active treatment; but this will happen before the risk coding has “caught up” to the expense. In other words, since benchmarks would be set before the cancer diagnoses were captured, the benchmark would not reflect the intensity of needed services in the current performance year. Exacerbating the issue, the specialist is likely to lose attribution for the patient the following year once treatment has finished and the patient resumes routine care from his or her primary care physician. As a result, under the MSSP, it is likely that a specialist’s panel risk scores will never accurately reflect the cost of caring for those beneficiaries.
These factors impact both the performance year and the setting of the historical benchmark. As part of the process to determine the benchmark, the average expenditure for the ACO population is compared to the risk-adjusted cost for Medicare beneficiaries in the region. A portion of the difference in cost for those populations is applied to the ACO’s benchmark, with ACOs that are higher cost than the region having the expenditure target lowered. This approach rewards ACOs that have historically lowered the cost for their beneficiaries. However, it has a perverse impact on specialist involvement.
Again, using an oncologist as an example, imagine the ACO is in a region of 20,000 Medicare beneficiaries and that 10,000 are attributed to the ACO. If there are 80 beneficiaries under active treatment for common cancers, that would be a rate of 40 per 10,000 population. However, if the oncologist is in an ACO, there is a chance that all 80 of those beneficiaries are attributed, which would create a rate of 80 per 10,000. As a result, even after risk adjustment, that ACO will likely have a negative adjustment applied to its benchmark.
This phenomenon disproportionately affects the high-revenue ACOs. The analysis found that high-revenue ACOs receive a higher proportion of lives through specialist attribution. Across the board, between 4-6 percent more beneficiaries assigned to high-revenue ACOs come in through specialists. While this may seem to be a small percentage, these specialists resulted in costs that are 11-16 percent higher overall than their primary care counterparts. Across a large swath of covered lives, these differentials can add up to meaningful cost differences.
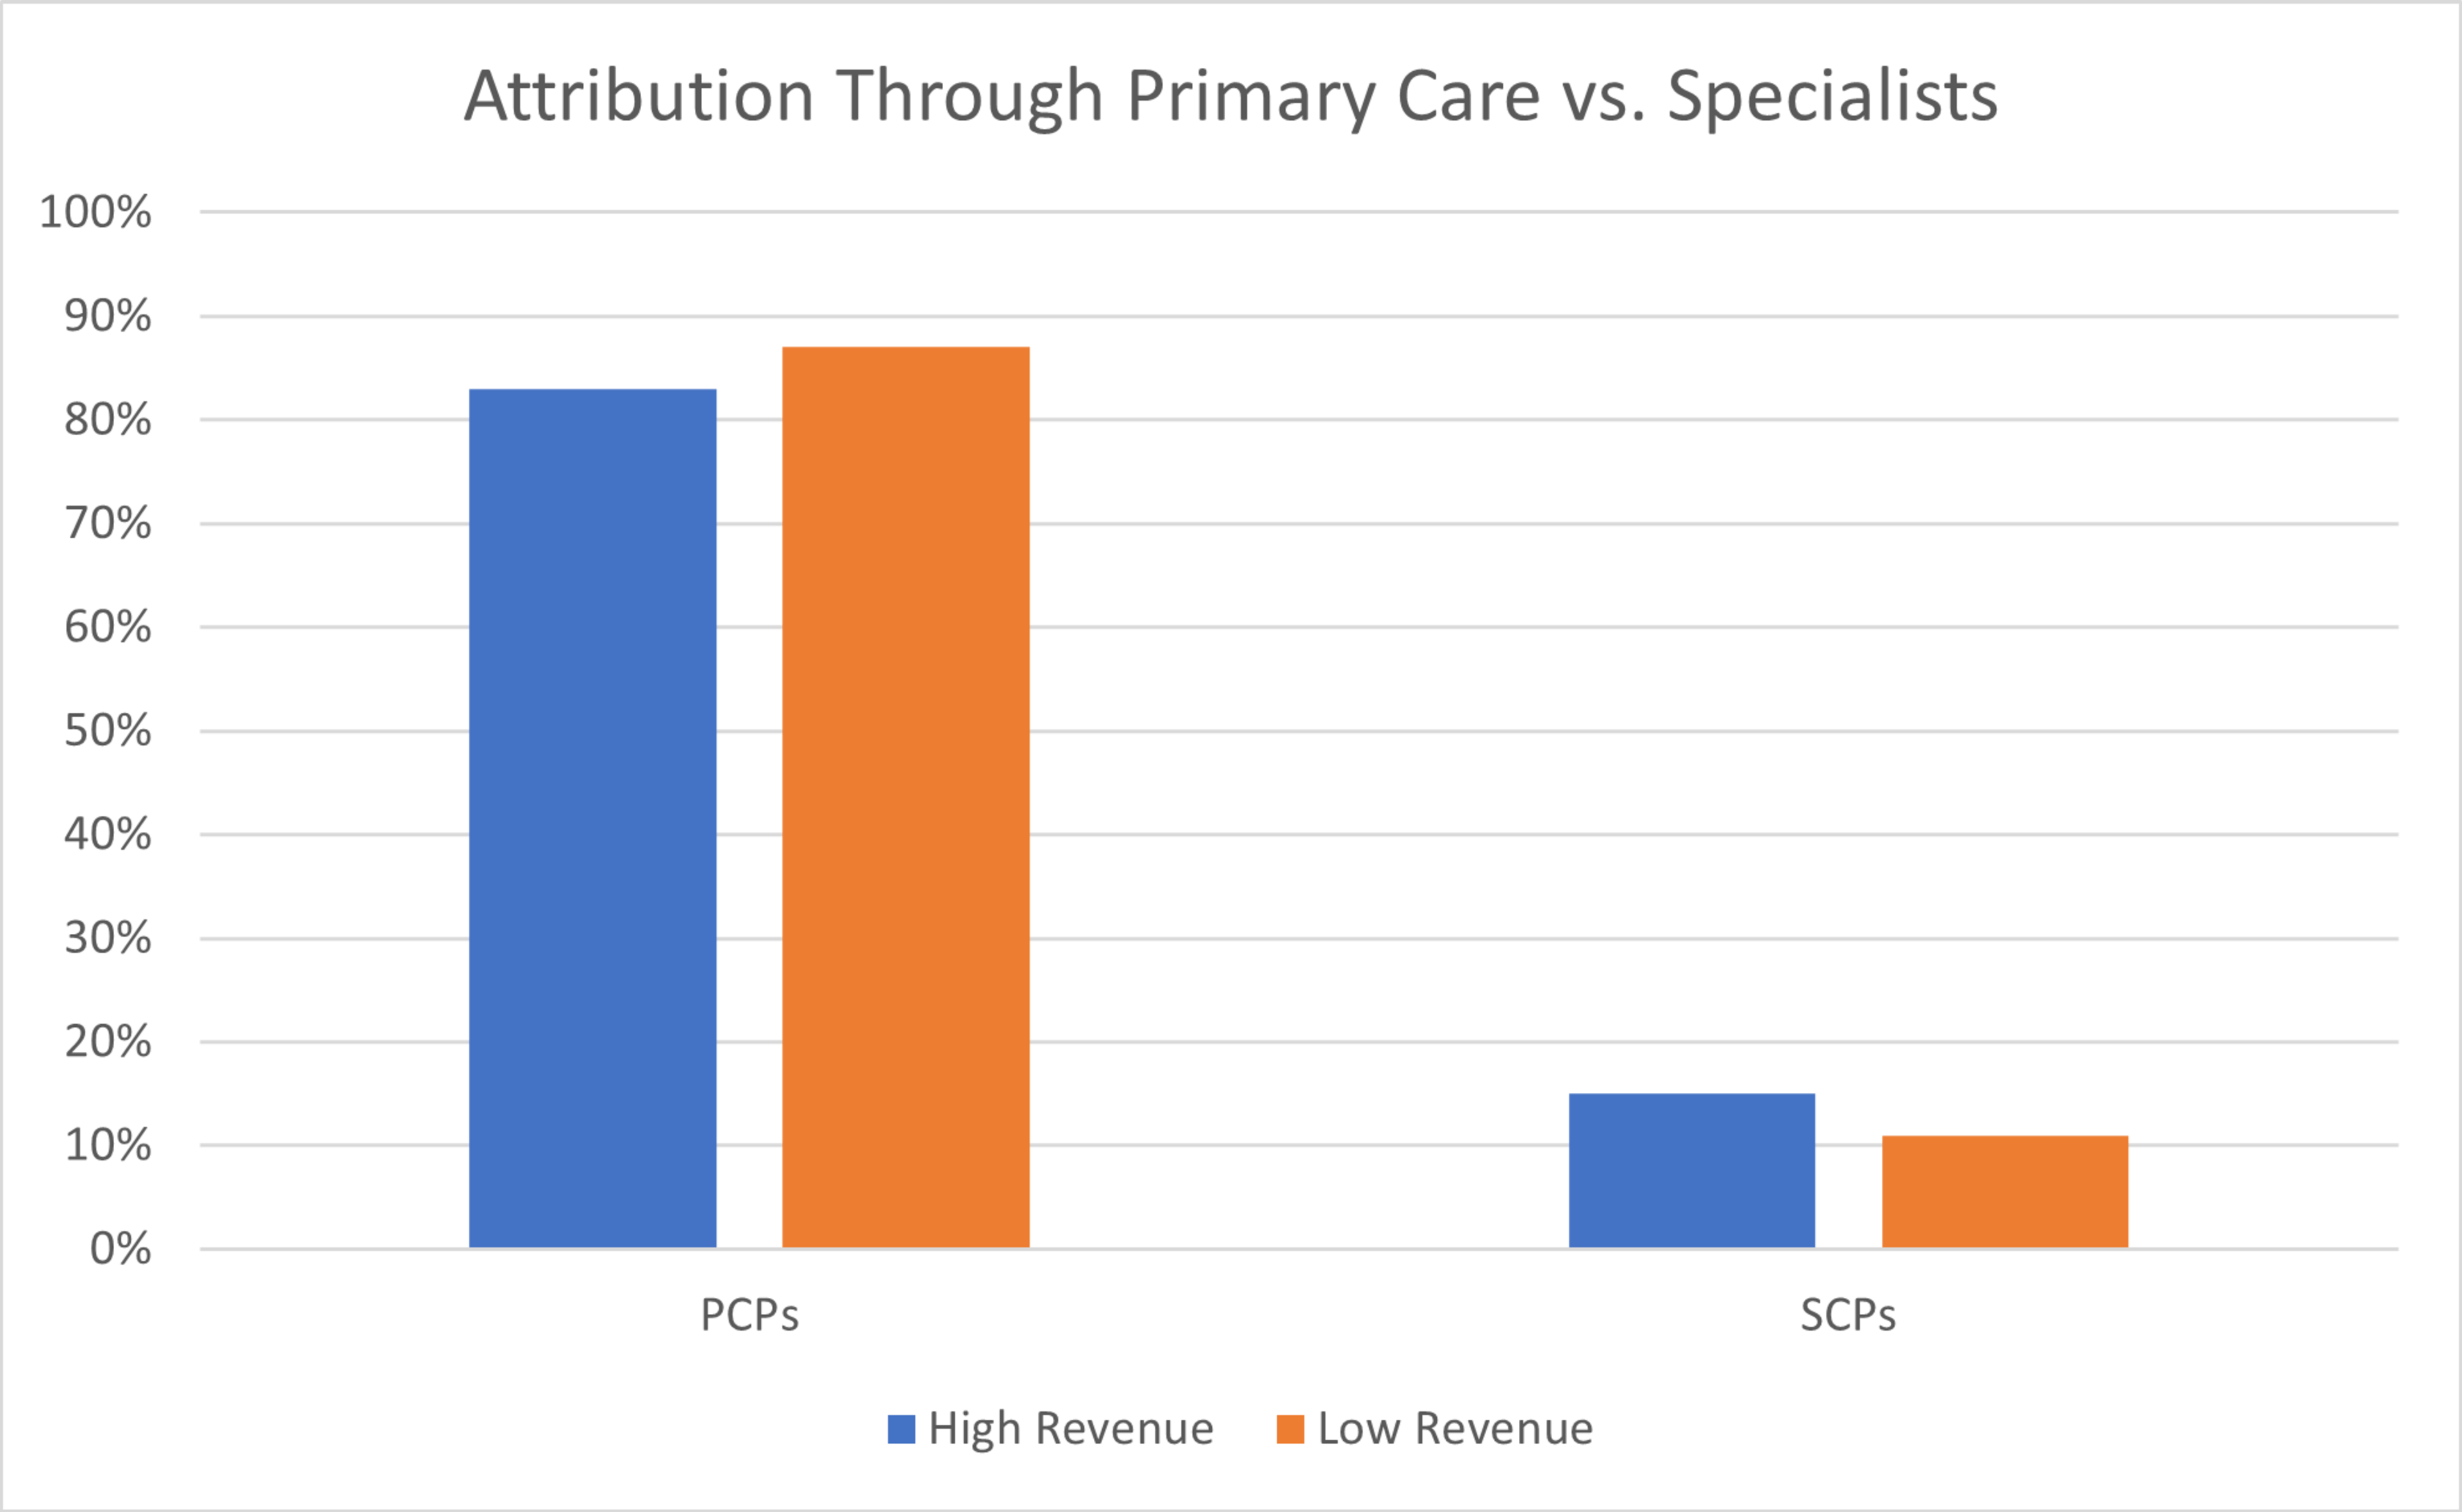
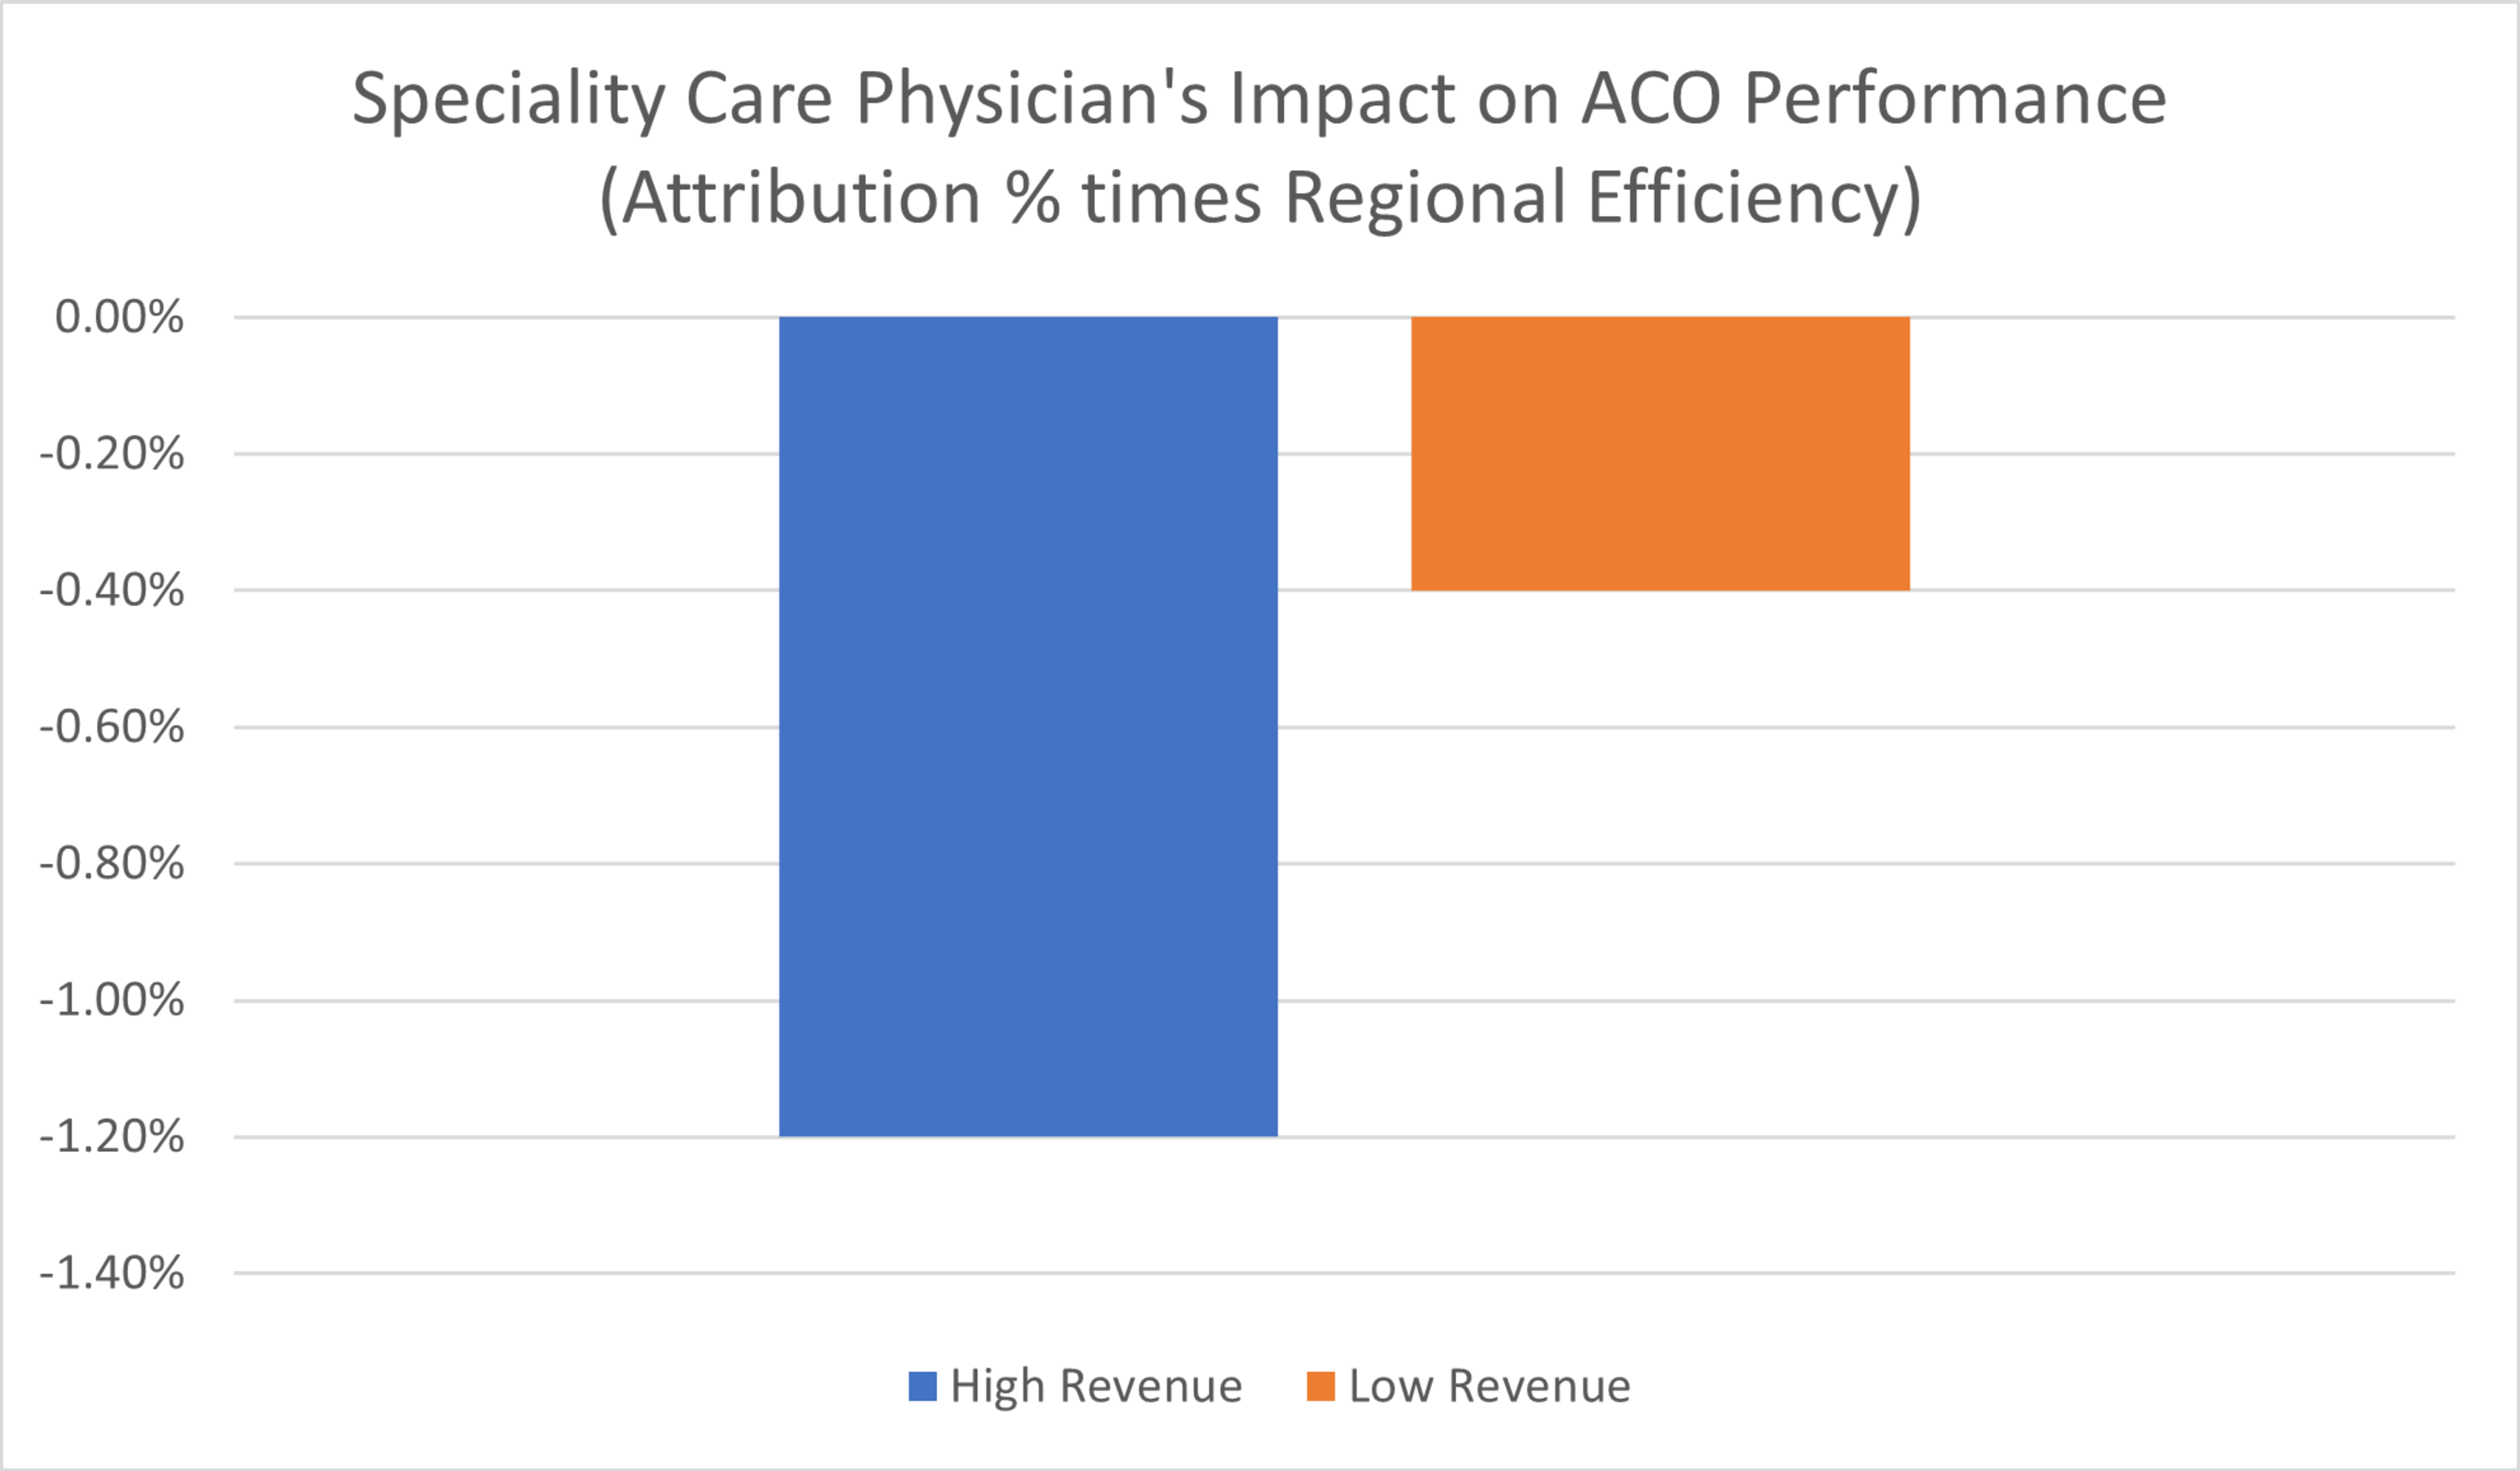
Source: Premier analysis. Charts above represent all beneficiary types for 2019 ACOs that had at least 4 years of MSSP participation as of 2019.
Even after accounting for risk, beneficiaries attributed through specialists have higher costs than others in a given region when compared to beneficiaries aligned through primary care providers.
It is unfair to punish high-revenue ACOs for specialist attribution or to create disincentives for providers to include specialists in value-based care. If anything, CMS needs to find more mechanisms to include specialists in the overall movement to value and total cost of care models.
Finding #3: No significant differences in performance could be found once adjustments accounted for differences in attribution and geography.
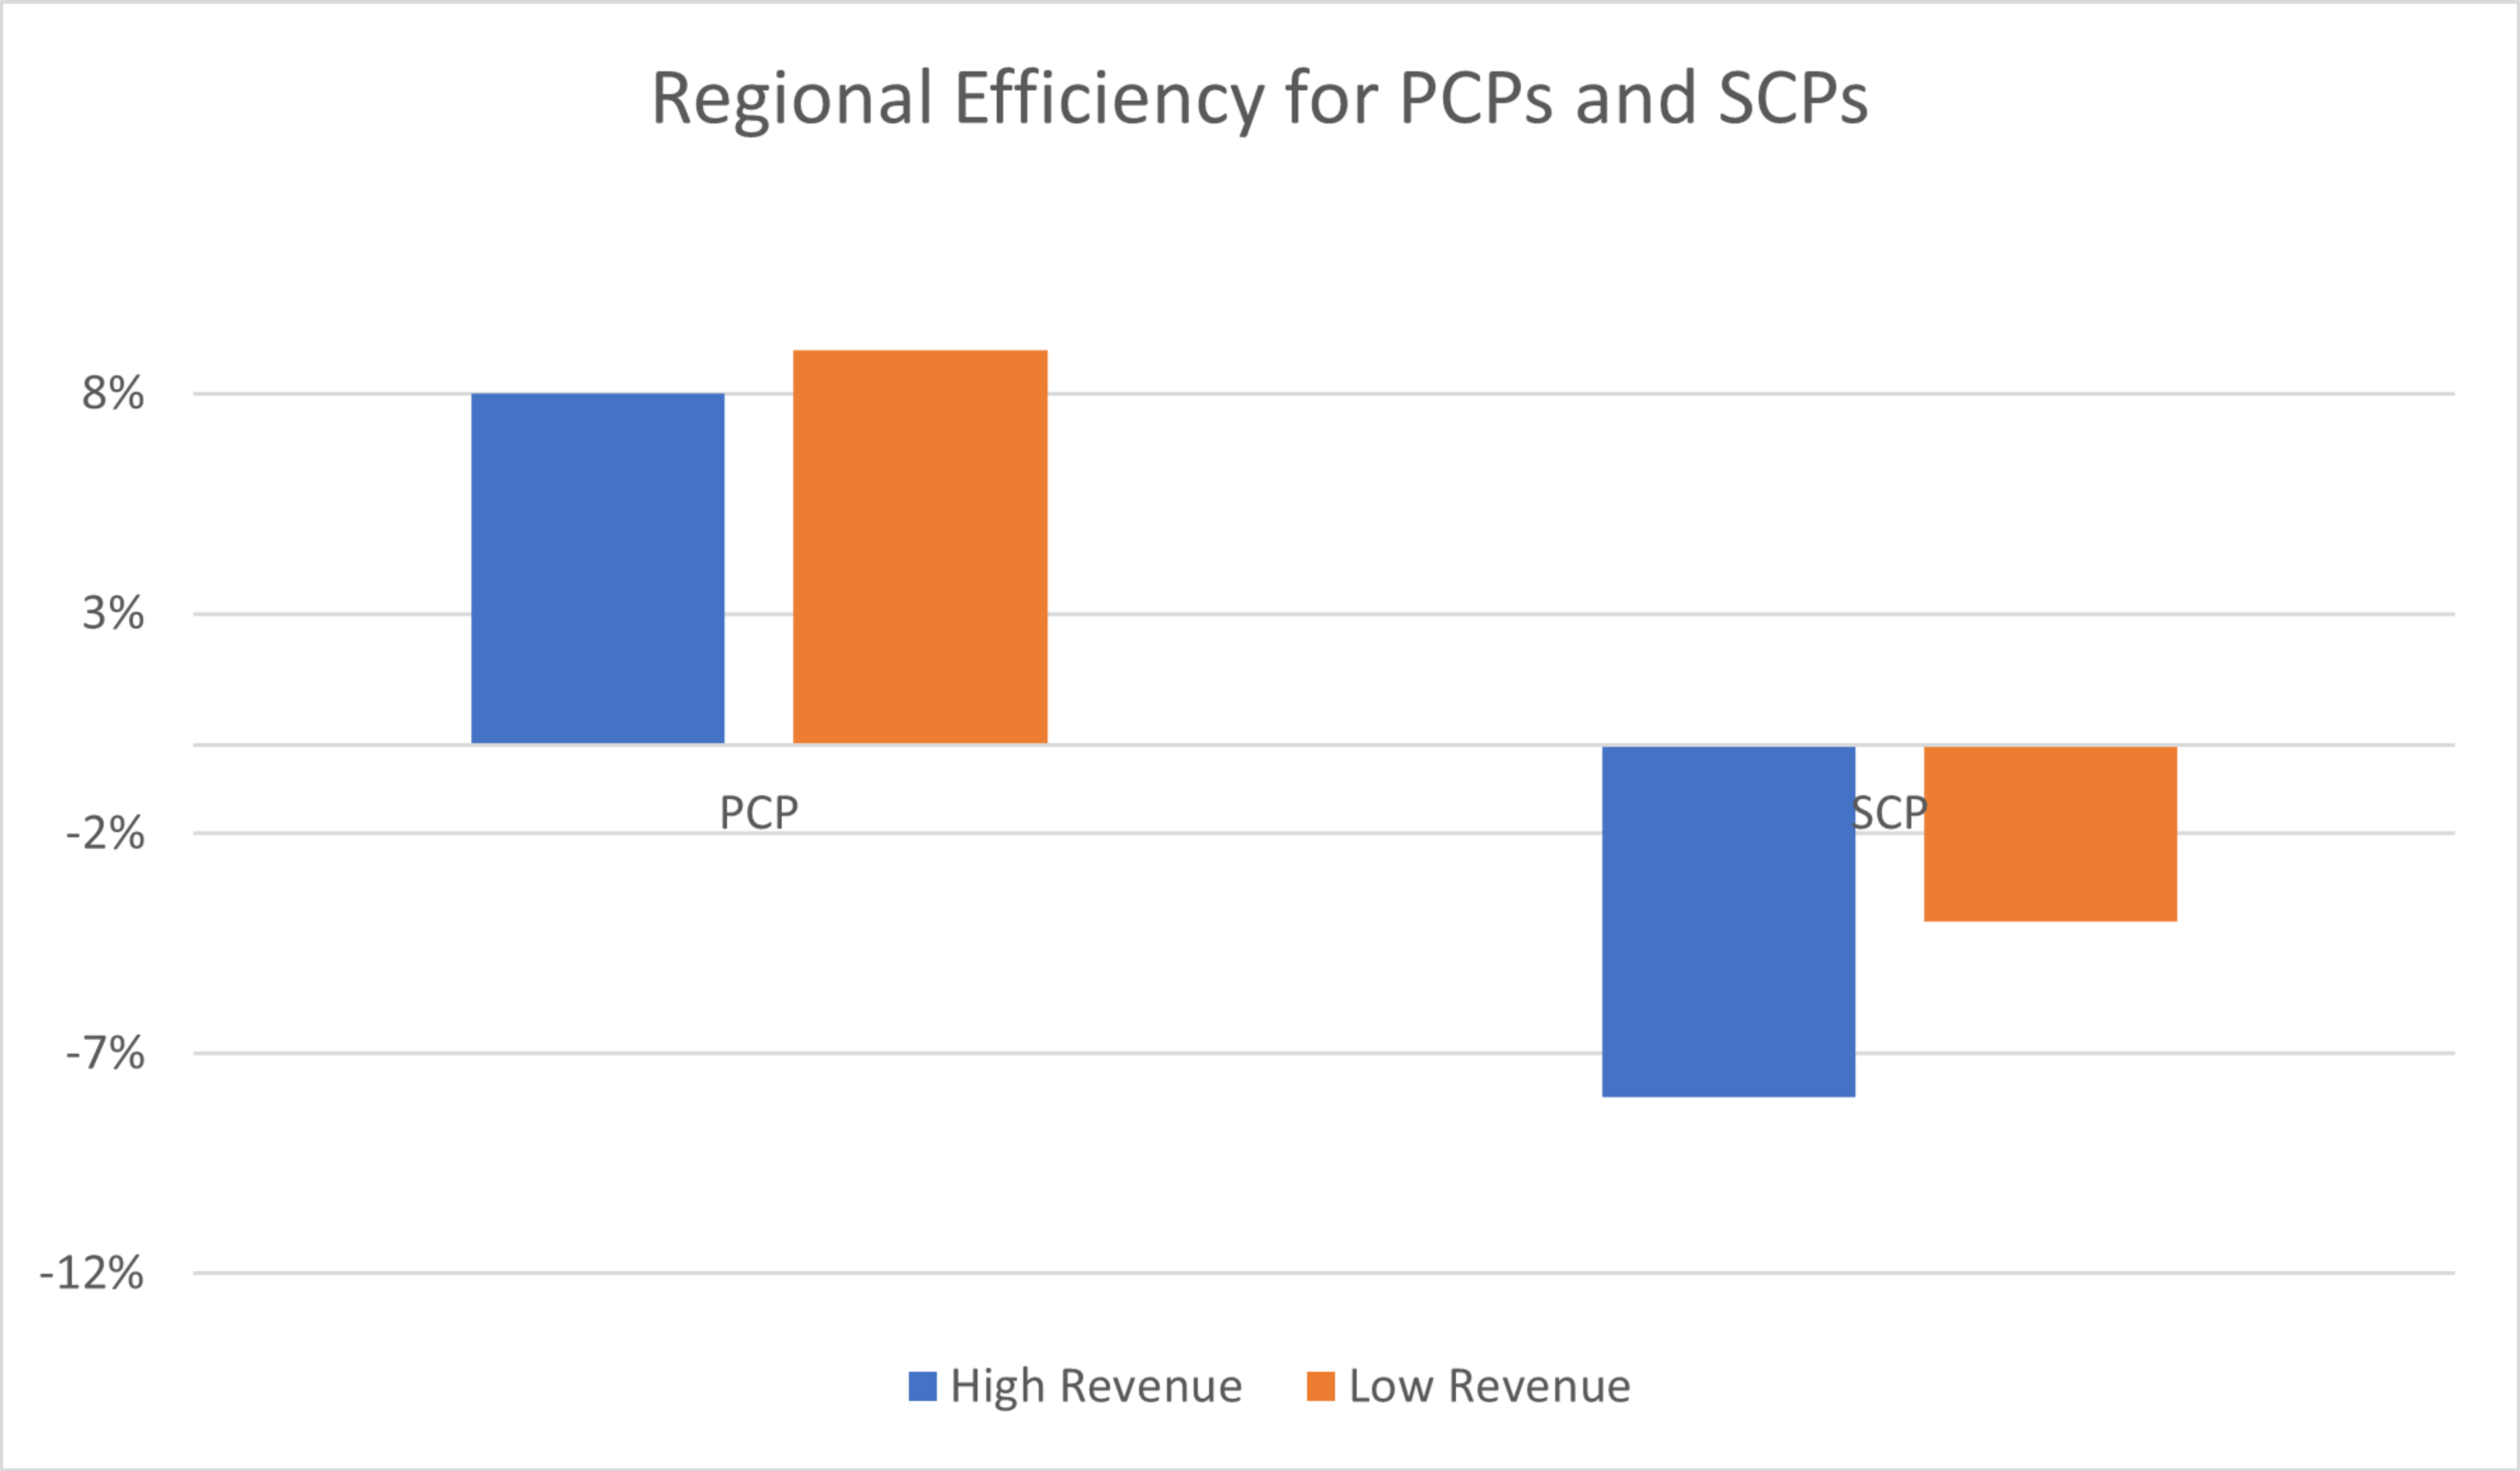
Prior to accounting for risk and geographic normalization, low-revenue ACOs appear to outperform high-revenue ACOs by 3-4 percent, based on data from recent years. However, after applying a more refined comparison of the regional efficiency of high- and low-revenue ACOs in this cohort, that number shrinks to 1-2 percent. Once accounting for the higher churn rate of low-revenue ACOs by isolating ACOs that have three or more years of participation, there was no significant difference in performance between high- versus low-revenue ACOs.
These findings suggest that additional adjustments must be made to account for differences in geographic regions and attribution when comparing the performance of high- and low-revenue ACOs.
Continuing to distinguish ACO participants as high- versus low-revenue creates an unlevel playing field that disadvantages hospital-led ACOs relative to their physician-led counterparts.
CMS exposes high-revenue ACOs to significantly greater levels of risk and limits their capacity to earn shared savings within the MSSP. This, in turn, has driven some health system ACOs to re-evaluate participation in the program.
In fall 2021, CMS set a goal5 of moving all Medicare beneficiaries into an accountable care relationship by 2030. To achieve this goal, CMS will need to craft ACO policies that do not limit provider participation and encourage ACOs to enter less attractive markets.
More must be done to ensure all providers have the same opportunities to succeed under value-based care. Hospitals and health systems are, and should remain, indispensable ACO participants and leaders. Hospital-led ACOs have significantly contributed to the success of the MSSP program:
- High-revenue ACOs cover more lives than low-revenue ACOs, coordinating care for more than 60 percent of all MSSP beneficiaries.
- High-revenue ACOs operate in more geographies: 2,337 counties, versus 1,546 counties for low-revenue ACOs, as noted above.
- Including hospitals in the ACO mix effectively balances access to primary care with increased focus on beneficiaries who require more. By definition, ACOs that include hospitals as formal network members cover a greater proportion of more ill (and more costly) lives. Incenting an equitable mix is a holistic approach to include a greater number of providers across the spectrum, while ensuring that the ACO model reaches patients who are sicker and more care intensive.
CMS recently proposed several notable changes to the MSSP, which are focused on attracting new providers into the program, improving the sustainability of the MSSP for existing ACOs and increasing the program’s reach to underserved populations. While these proposals would align the risk tracks for low- and high-revenue ACOs, CMS continues to assert that low-revenue ACOs perform better than high-revenue ACOs. This belief translates into proposed policies that are limited to low-revenue ACOs only, including upfront investment payments and additional opportunities to earn shared savings.
As policymakers debate future changes to the MSSP – including recent proposals under the CY2023 Physician Fee Schedule – discussions should not be clouded by dubious correlations between size and performance or by inclusion of hospitals as formal participants. Eliminating the high-low revenue and physician-hospital distinctions to re-level the playing field for all program participants should be a priority.
Additionally, we continue to urge CMS to work with stakeholders to modify its risk-adjustment methodology and benchmarking approach to better account for the costs of beneficiaries, especially those with complex and high-cost medical needs. As part of that, CMS should:
- Stratify its current benchmarking approach – which is based on Medicare enrollment status – to set separate benchmarks for patients with certain high-cost chronic conditions or treatments.
- Standardize its risk adjustment methodology across all Medicare programs and models. At a minimum, CMS should align the methodology used in MSSP Enhanced with Medicare Advantage.
- Increase its risk score cap to 5 percent to better account for changes in risk score over the agreement period.
METHODOLOGY
Data Sources:
The authors used 2016-2019 claims within the Medicare 100 percent Research Identifiable Files (RIF) data set, for beneficiaries enrolled in Medicare Fee for Service (FFS) Parts A and B. These files contain all Medicare Parts A and B paid claims generated by all Medicare FFS beneficiaries. Information in the files includes diagnosis codes, procedure codes, diagnosis-related group (DRG) codes, site-of-service information, national drug codes (NDC) and beneficiary information (including age, eligibility status, low-income status and an indicator for health maintenance organization (HMO) enrollment). The CMS data was relied upon without audit or verification. Publicly available information was used to flag each ACO as high or low revenue.
Analytical Process:
As a first step – given that the RIF data set provides yearly enrollment information for each ACO -- all beneficiaries who were attributed to an MSSP ACO in each of 2016, 2017, 2018 or 2019, were identified.
A necessary second step in the analysis was to normalize the relative cost of these beneficiaries for risk and geography. To achieve this, the authors divided observed per-beneficiary-per-year (PBPY) spending by observed “hierarchical condition category” (CMS-HCC) risk score for each ACO cohort’s attributed lives; and compared this risk-adjusted PBPY to the regional risk-normalized PBPY – calculated as the ACO-beneficiary weighted average PBPY across all counties the ACO pulled lives from the Medicare 100 percent data.
The resulting “Regional Efficiency” allowed comparison of the cost of high- and low-revenue ACOs in aggregate, normalized for risk and geographic difference. This metric is also relevant to observe model performance between these cohorts, as the MSSP uses a similar calculation to increase/decrease an ACO’s historical benchmark.
Sources Cited:
- https://www.cms.gov/newsroom/fact-sheets/final-rule-creates-pathways-success-medicare-shared-savings-program
- https://data.cms.gov/medicare-...; Includes 4 high cost / special needs ACOs with average beneficiary cost over $20,000
- Medicare Shared Savings Program SHARED SAVINGS AND LOSSES AND ASSIGNMENT METHODOLOGY, January 2022 Version 10, Appendix C, Tables 9 and 10, https://www.cms.gov/files/document/medicare-shared-savings-program-shared-savings-and-losses-and-assignment-methodology-specifications.pdf-1
- MedPac Report to the Congress: Medicare and the Health Care Delivery System | June 2014 Chap 2, Pg 22 https://www.medpac.gov/wp-content/uploads/import_data/scrape_files/docs/default-source/reports/jun14_ch02.pdf
- https://innovation.cms.gov/str...
The insights you need to stay ahead in healthcare: Subscribe to Premier’s Power Rankings newsletter and get our experts’ original content delivered to your inbox once a month.
Article Information